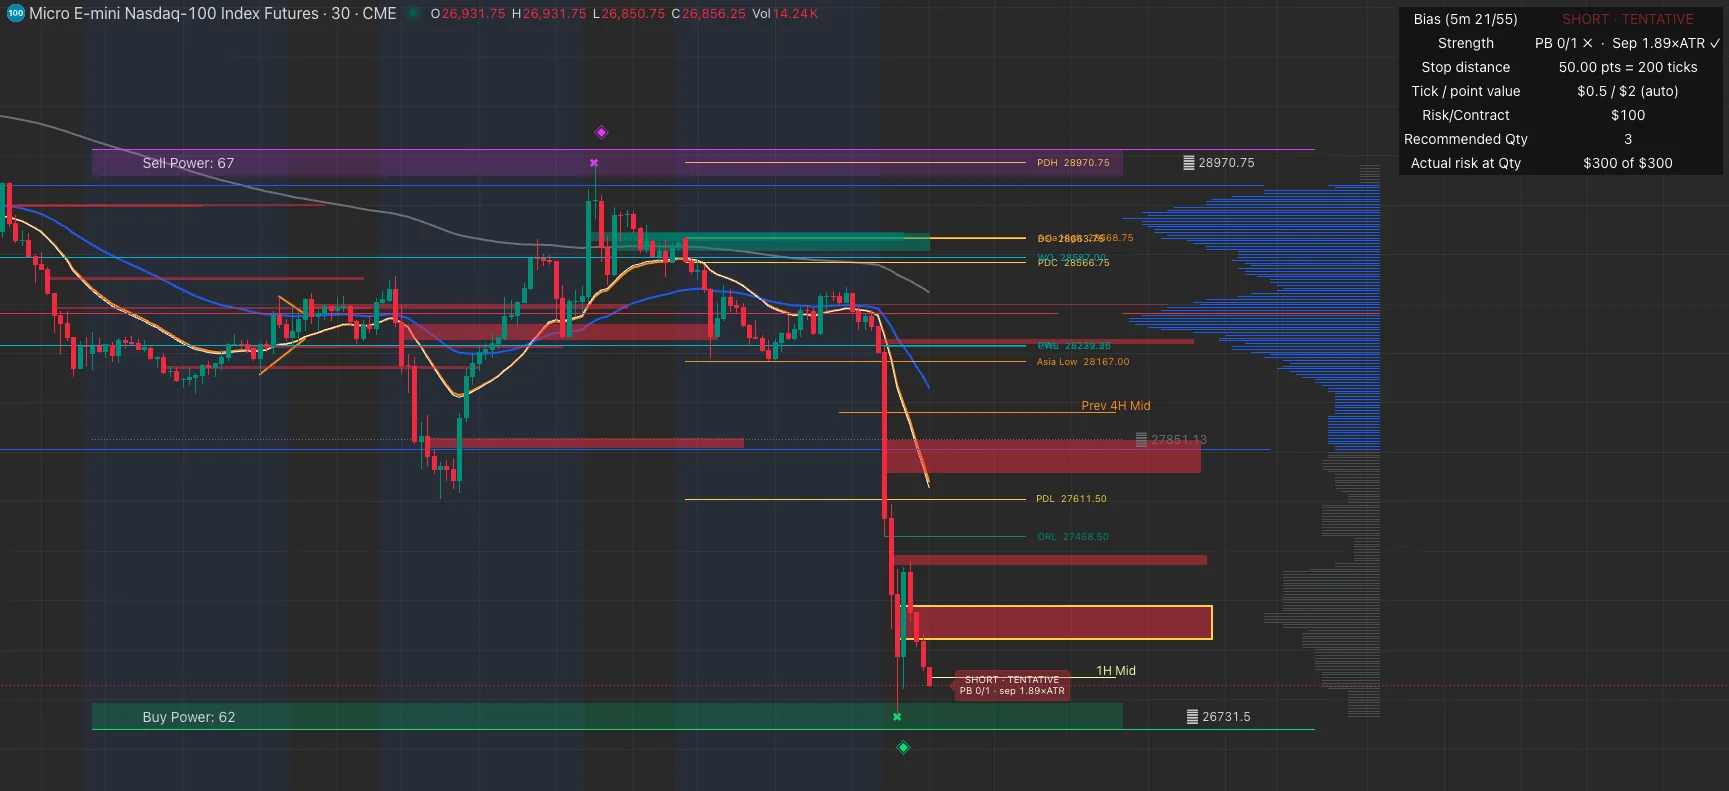
Script Copy script // ═══════════════════════════════════════════════════════════════════════════════════════════════
// MNQ Toolkit · v1.0 · October 2026
// by David J Kaplan · https://propvalue.co/indicators/mnq-toolkit/
// ═══════════════════════════════════════════════════════════════════════════════════════════════
// One overlay for intraday index-futures trading (built on MNQ; works on NQ, MES, ES and others).
// Six modules, each switchable from the "▶ Modules" group at the top of the settings:
//
// 1 Trend + Sizing 5m EMA 21/55 bias with an optional EMA 200 macro filter, a 1m EMA 20
// pullback guide, stop-distance bands and a position-size table.
// 1b Trend Strength Grades the bias STRONG or TENTATIVE from confirmed pullbacks
// (clear of the EMA, tag it, then a new trend extreme) and, optionally,
// how far apart the 21 and 55 are in 5m ATR units.
// 2 S&R Power Channel Lookback high/low channel with ATR-width zones, buy/sell power counts
// and rejection markers.
// 3 Volume Profile Fixed-range or visible-range profile with Point of Control and Value Area.
// 4 Key Levels Previous day/week/month highs, lows and closes, period opens, overnight
// (Globex) high/low and opening range, with cross alerts.
// 5 VWAP Anchored VWAP (custom clock time, session, RTH, week or month) with
// σ bands and an optional weekly VWAP.
// 6 Fair Value Gaps Three-bar gaps from the chart or a higher timeframe, filtered by the
// module 1 bias, with forming and confirmed states.
//
// Quick start: add to a 1-minute or 5-minute MNQ chart, set "Risk per trade" and "Stop distance" in
// module 1, then switch off the modules you don't use.
//
// Credits and licences
// Module 2 is adapted from "Support and Resistance Power Channel" © ChartPrime, and module 3 from
// "Volume Profile" © kv4coins. Both are published under the Mozilla Public License 2.0; those
// portions remain under MPL-2.0 (https://mozilla.org/MPL/2.0/).
// All other modules are original work by David J Kaplan.
//
// Free to use and modify. Not financial advice: test on a simulated account before trading live.
// ═══════════════════════════════════════════════════════════════════════════════════════════════
//@version=6
indicator("MNQ Toolkit (Trend/Size + S&R + VP + Key Levels + FVG)", "MNQ Toolkit", overlay = true,
max_bars_back = 5000, max_lines_count = 500, max_labels_count = 500, max_boxes_count = 500)
// ═══════════════════════════════════════════════════════════════════════════════════════════════
// ▶ MODULES (master switches)
// ═══════════════════════════════════════════════════════════════════════════════════════════════
G_MOD = "▶ Modules"
mnq_enable = input.bool(true, "MNQ Trend + Sizing", group = G_MOD, tooltip = "5m EMA 21/55 bias, 5m EMA 200 macro filter, 1m EMA 20 pullback guide, stop-distance bands and position-size table.")
sr_enable = input.bool(true, "S&R Power Channel", group = G_MOD, tooltip = "ChartPrime lookback high/low channel with ATR bands, buy/sell power and rejection signals.")
vp_enable = input.bool(true, "Volume Profile", group = G_MOD, tooltip = "kv4coins fixed-range / visible-range volume profile with Point of Control and Value Area.")
kl_enable = input.bool(true, "Key Levels", group = G_MOD, tooltip = "Previous day / week / month levels, period opens, overnight session range and opening range.")
vw_enable = input.bool(true, "VWAP", group = G_MOD, tooltip = "Anchored VWAP (custom time / session / RTH / week / month) with standard-deviation bands and optional weekly VWAP.")
fvg_enable = input.bool(true, "Fair Value Gaps", group = G_MOD, tooltip = "FVG boxes (optionally from a higher timeframe), filtered by the 5m bias.")
// ═══════════════════════════════════════════════════════════════════════════════════════════════
// 1 · MNQ TREND + SIZING — inputs
// ═══════════════════════════════════════════════════════════════════════════════════════════════
G_MNQ = "1 · MNQ Trend + Sizing"
riskUsd = input.float(300, "Risk per trade ($)", step = 10, minval = 0, group = G_MNQ,
tooltip = "The most you want to lose if the stop is hit. The table sizes the position to stay within it.")
distUnit = input.string("Points", "Stop distance unit", options = ["Points", "Ticks"], group = G_MNQ,
tooltip = "TradingView's Long/Short position tool uses TICKS. MNQ tick = 0.25 pt.")
distIn = input.float(50, "Stop distance", step = 1, minval = 0.25, group = G_MNQ,
tooltip = "Distance from entry to stop, in the unit chosen above. Drawn as the green/red bands.")
anchorMode = input.string("Current price", "Anchor", options = ["Current price", "Previous bar close", "Manual price"], group = G_MNQ,
tooltip = "Where the stop-distance bands are centred: the live price, the last closed bar, or a price you type in.")
manualAnchor = input.float(0.0, "Manual anchor price (0 = unused)", step = 0.25, group = G_MNQ)
pointValueOvr = input.float(0.0, "Point value override ($/pt, 0 = auto)", step = 0.5, group = G_MNQ,
tooltip = "Leave at 0 to use syminfo.pointvalue. MNQ should be 2, NQ 20, MES 5, ES 50.")
useMacro200 = input.bool(true, "Use 5m EMA200 macro filter", group = G_MNQ)
mnq_showEmas = input.bool(true, "Show EMAs", group = G_MNQ)
mnq_showBg = input.bool(true, "Shade background by bias", group = G_MNQ)
mnq_showBands = input.bool(true, "Show stop-distance bands", group = G_MNQ)
extendRight = input.bool(true, "Extend bands right", group = G_MNQ)
showTable = input.bool(true, "Show sizing table", group = G_MNQ)
tablePos = input.string("Top right", "Table position", options = ["Top right", "Top left", "Bottom right", "Bottom left", "Middle right"], group = G_MNQ)
// ═══════════════════════════════════════════════════════════════════════════════════════════════
// 1b · TREND STRENGTH — inputs
// ═══════════════════════════════════════════════════════════════════════════════════════════════
G_TS = "1b · Trend Strength"
ts_enable = input.bool(true, "Classify trend as STRONG / TENTATIVE", group = G_TS)
ts_pbSrc = input.string("5m EMA 21", "Pullback EMA", options = ["5m EMA 21", "1m EMA 20"], group = G_TS,
tooltip = "The average a pullback has to tag. 5m EMA 21 gives fewer, more meaningful pullbacks. 1m EMA 20 confirms much faster.")
ts_pbNeeded = input.int(1, "Confirmed pullbacks needed", minval = 0, maxval = 5, group = G_TS,
tooltip = "A confirmed pullback = price trades fully clear of the EMA, comes back to tag it, then makes a new high (long) / new low (short) beyond the pre-pullback extreme. 0 = structure not required.")
ts_tolTicks = input.int(4, "Touch tolerance (ticks)", minval = 0, group = G_TS,
tooltip = "How close to the EMA counts as a tag. Also the clearance needed before a pullback can start.")
ts_resetDeep = input.bool(true, "Reset count if a pullback closes through 5m EMA 55", group = G_TS)
ts_useSep = input.bool(true, "Also require 21/55 separation", inline = "tssep", group = G_TS)
ts_sepMin = input.float(0.5, "Min (× 5m ATR)", minval = 0, step = 0.05, inline = "tssep", group = G_TS)
ts_atrLen = input.int(14, "ATR length (5m bars)", minval = 1, group = G_TS)
ts_showMarks = input.bool(true, "Mark confirmed pullbacks (PB)", group = G_TS)
// ═══════════════════════════════════════════════════════════════════════════════════════════════
// 2 · S&R POWER CHANNEL — inputs
// ═══════════════════════════════════════════════════════════════════════════════════════════════
G_SR = "2 · S&R Power Channel"
int sr_length = input.int(130, "Lookback length", minval = 10, maxval = 490, group = G_SR)
int sr_extend = input.int(30, "Extend (bars)", minval = 20, maxval = 100, group = G_SR)
color sr_t_col = input.color(color.fuchsia, "Top", inline = "srcol", group = G_SR)
color sr_b_col = input.color(color.lime, "Bottom", inline = "srcol", group = G_SR)
bool sr_showSignals = input.bool(true, "Show rejection signals (◈)", group = G_SR)
bool sr_showPower = input.bool(true, "Show buy/sell power text", group = G_SR)
// ═══════════════════════════════════════════════════════════════════════════════════════════════
// 3 · VOLUME PROFILE — inputs
// ═══════════════════════════════════════════════════════════════════════════════════════════════
G_VP1 = "3 · Volume Profile · Lookback"
G_VP2 = "3 · Volume Profile · Bars"
G_VP3 = "3 · Volume Profile · PoC / Value Area"
vp_use_visible_range = input.bool(false, "Use Visible Range", group = G_VP1, tooltip = "Calculate Volume Profile using all visible bars in the current chart")
vp_lookback_depth = input.int(200, "Fixed Range Lookback Depth [10-3000]", minval = 10, maxval = 3000, group = G_VP1, tooltip = "Number of historical bars to include. Ignored if \"Use Visible Range\" is enabled")
vp_num_bars = input.int(200, "Number of Volume Bars [10-400]", minval = 10, maxval = 400, group = G_VP2)
vp_bar_thickness = input.int(1, "Volume Bar Thickness [1-30]", minval = 1, maxval = 30, group = G_VP2)
vp_bar_len_mult = input.int(20, "Bar Length Multiplier [1-50]", minval = 1, maxval = 50, group = G_VP2)
vp_right_offset = input.int(70, "Right Offset [0-400]", minval = 0, maxval = 400, group = G_VP2)
vp_volume_type = input.string("Both", "Volume Type", options = ["Both", "Bullish", "Bearish"], group = G_VP2)
vp_bar_color = input.color(color.new(color.gray, 50), "Volume Bar Color", group = G_VP2)
vp_display_poc = input.bool(true, "Display Point of Control (PoC)", group = G_VP3)
vp_poc_line_thickness = input.int(1, "PoC Line Thickness [1-30]", minval = 1, maxval = 30, group = G_VP3)
vp_poc_line_color = input.color(color.red, "PoC Line Color", group = G_VP3)
vp_display_va = input.bool(true, "Display Value Area", group = G_VP3)
vp_va_percent = input.int(68, "Value Area Percentage(%) [5-95]", minval = 5, maxval = 95, group = G_VP3)
vp_va_bar_color = input.color(color.blue, "Value Area Bar Color", group = G_VP3)
vp_display_va_lines = input.bool(true, "Display Value Area Lines", group = G_VP3, tooltip = "Ignored if \"Display Value Area\" is disabled")
vp_va_lines_thickness = input.int(1, "Value Area Lines Thickness [1-20]", minval = 1, maxval = 20, group = G_VP3)
// ═══════════════════════════════════════════════════════════════════════════════════════════════
// 4 · KEY LEVELS — inputs
// ═══════════════════════════════════════════════════════════════════════════════════════════════
G_KL1 = "4 · Key Levels · Daily"
G_KL2 = "4 · Key Levels · Weekly / Monthly"
G_KL3 = "4 · Key Levels · Sessions"
G_KL4 = "4 · Key Levels · Style"
kl_pdh = input.bool(true, "Prev day high (PDH)", inline = "pd1", group = G_KL1)
kl_pdl = input.bool(true, "Prev day low (PDL)", inline = "pd1", group = G_KL1)
kl_pdc = input.bool(true, "Prev day close (PDC)", inline = "pd2", group = G_KL1)
kl_pdm = input.bool(false, "Prev day mid (PDM)", inline = "pd2", group = G_KL1)
kl_cdo = input.bool(true, "Today's open (DO)", inline = "pd3", group = G_KL1)
kl_cdh = input.bool(false, "Today's high/low (HOD/LOD)", inline = "pd3", group = G_KL1)
kl_pdCol = input.color(color.new(color.yellow, 0), "Daily colour", group = G_KL1)
kl_pwh = input.bool(true, "Prev week high (PWH)", inline = "pw1", group = G_KL2)
kl_pwl = input.bool(true, "Prev week low (PWL)", inline = "pw1", group = G_KL2)
kl_pwc = input.bool(false, "Prev week close (PWC)", inline = "pw2", group = G_KL2)
kl_cwo = input.bool(true, "Week open (WO)", inline = "pw2", group = G_KL2)
kl_pwCol = input.color(color.new(color.aqua, 0), "Weekly colour", group = G_KL2)
kl_pmh = input.bool(false, "Prev month high (PMH)", inline = "pm1", group = G_KL2)
kl_pml = input.bool(false, "Prev month low (PML)", inline = "pm1", group = G_KL2)
kl_cmo = input.bool(false, "Month open (MO)", inline = "pm2", group = G_KL2)
kl_pmCol = input.color(color.new(color.purple, 0), "Monthly colour", group = G_KL2)
kl_on = input.bool(true, "Overnight session high/low (ONH/ONL)", group = G_KL3)
kl_onSess = input.session("1800-0930", "Overnight session", group = G_KL3, tooltip = "Globex overnight for CME index futures is 18:00–09:30 New York. For stocks use pre-market e.g. 0400-0930.")
kl_onCol = input.color(color.new(color.orange, 0), "Overnight colour", group = G_KL3)
kl_or = input.bool(true, "Opening range high/low (ORH/ORL)", group = G_KL3)
kl_orMid = input.bool(false, "Opening range midpoint (ORM)", group = G_KL3)
kl_orSess = input.session("0930-0945", "Opening range session", group = G_KL3, tooltip = "First N minutes of the regular session, e.g. 0930-0935, 0930-0945, 0930-1000.")
kl_orCol = input.color(color.new(color.teal, 0), "Opening range colour", group = G_KL3)
kl_tz = input.string("America/New_York", "Session timezone", group = G_KL3)
kl_style = input.string("Solid", "Line style", options = ["Solid", "Dashed", "Dotted"], group = G_KL4)
kl_width = input.int(1, "Line width", minval = 1, maxval = 4, group = G_KL4)
kl_fromStart = input.bool(true, "Start line at period/session start", group = G_KL4, tooltip = "Off = start the line a fixed number of bars back.")
kl_maxBars = input.int(300, "Max line length (bars)", minval = 10, maxval = 4000, group = G_KL4)
kl_extend = input.bool(false, "Extend lines right (infinite)", group = G_KL4)
kl_labelOff = input.int(15, "Label offset (bars right of price)", minval = 1, maxval = 200, group = G_KL4)
kl_labelSize = input.string("small", "Label size", options = ["tiny", "small", "normal", "large"], group = G_KL4)
kl_showPrice = input.bool(true, "Show price in label", group = G_KL4)
kl_alerts = input.bool(true, "Enable key-level cross alerts", group = G_KL4, tooltip = "Creates alert conditions for close crossing PDH / PDL / PDC / ONH / ONL / ORH / ORL. Add via the Alerts dialog.")
// ═══════════════════════════════════════════════════════════════════════════════════════════════
// 5 · VWAP — inputs
// ═══════════════════════════════════════════════════════════════════════════════════════════════
G_VW = "5 · VWAP"
vw_anchor = input.string("Custom time", "Anchor", options = ["Session (daily)", "Custom time", "RTH session", "Week", "Month"], group = G_VW,
tooltip = "Custom time resets VWAP at the clock time below, in the Key Levels session timezone (default 18:00 New York = Globex open). Session (daily) resets at the daily bar boundary. RTH session resets at the start of the RTH session below.")
vw_anchorH = input.int(18, "Custom anchor time H", minval = 0, maxval = 23, inline = "vwt", group = G_VW)
vw_anchorM = input.int(0, "M", minval = 0, maxval = 59, inline = "vwt", group = G_VW)
vw_rthSess = input.session("0930-1600", "RTH session (for RTH anchor)", group = G_VW)
vw_src = input.source(hlc3, "Source", group = G_VW)
vw_col = input.color(color.new(color.white, 0), "VWAP colour", inline = "vwl", group = G_VW)
vw_width = input.int(2, "Width", minval = 1, maxval = 4, inline = "vwl", group = G_VW)
vw_b1 = input.bool(true, "Band 1", inline = "vwb1", group = G_VW)
vw_m1 = input.float(1.0, "×σ", minval = 0.1, step = 0.1, inline = "vwb1", group = G_VW)
vw_b2 = input.bool(true, "Band 2", inline = "vwb2", group = G_VW)
vw_m2 = input.float(2.0, "×σ", minval = 0.1, step = 0.1, inline = "vwb2", group = G_VW)
vw_b3 = input.bool(false, "Band 3", inline = "vwb3", group = G_VW)
vw_m3 = input.float(3.0, "×σ", minval = 0.1, step = 0.1, inline = "vwb3", group = G_VW)
vw_bandCol = input.color(color.new(color.silver, 0), "Band colour", inline = "vwbc", group = G_VW)
vw_fill = input.bool(true, "Fill bands", inline = "vwbc", group = G_VW)
vw_showW = input.bool(false, "Also show weekly VWAP", inline = "vww", group = G_VW)
vw_wCol = input.color(color.new(color.fuchsia, 0), "", inline = "vww", group = G_VW)
vw_alerts = input.bool(true, "Enable VWAP cross alert", group = G_VW)
// ═══════════════════════════════════════════════════════════════════════════════════════════════
// SHARED HELPERS
// ═══════════════════════════════════════════════════════════════════════════════════════════════
roundToTick(float x) =>
math.round(x / syminfo.mintick) * syminfo.mintick
// Global-scope ta.* calls (kept out of conditional blocks so their series stay consistent).
// "5m" EMAs: on charts below 5 minutes the length is scaled up (e.g. a 21-period 5m EMA becomes a
// 105-period EMA on a 1m chart). This tracks the true 5m EMA closely, updates every chart bar and
// avoids request.security repaint issues. On 5m and higher charts the plain lengths are used.
tfRatio = math.max(1, math.round(300 / timeframe.in_seconds()))
ema21_5m = ta.ema(close, 21 * tfRatio)
ema55_5m = ta.ema(close, 55 * tfRatio)
ema200_5m = ta.ema(close, 200 * tfRatio)
pullbackEma_1m = ta.ema(close, 20)
srAtrHalf = ta.atr(200) * 0.5
// 5m ATR for the trend-strength separation check (uses the chart timeframe if the chart is above 5m)
ts_atrTf = timeframe.in_seconds() <= 300 ? "5" : timeframe.period
atr5m = request.security(syminfo.tickerid, ts_atrTf, ta.atr(ts_atrLen))
// ═══════════════════════════════════════════════════════════════════════════════════════════════
// 1 · MNQ TREND + SIZING — logic
// ═══════════════════════════════════════════════════════════════════════════════════════════════
// Bias: LONG when the 5m EMA 21 is above the 55 (and price is above the EMA 200 if the macro filter
// is on); SHORT for the reverse; neutral otherwise. The background shading and the table follow it.
// Sizing: contracts = floor(risk per trade ÷ (stop distance in points × point value)).
bullBias = ema21_5m > ema55_5m
bearBias = ema21_5m < ema55_5m
macroBullOk = not useMacro200 or close > ema200_5m
macroBearOk = not useMacro200 or close < ema200_5m
trendUp = mnq_enable and bullBias and macroBullOk
trendDown = mnq_enable and bearBias and macroBearOk
// ── 1b · Trend strength
// A small state machine per trend leg:
// armed → price has traded fully clear of the pullback EMA (by the touch tolerance)
// inPb → price came back and tagged the EMA
// confirm→ price then made a new high (long) / low (short) beyond the pre-pullback extreme
// Each confirmation adds one to the count. A pullback that closes through the 5m EMA 55 is "deep"
// and resets the count. STRONG = enough confirmed pullbacks (and enough 21/55 separation, if used).
// Direction uses the same rule as the table bias (21/55 + optional EMA200), independent of the module switch.
trendDir = bullBias and macroBullOk ? 1 : bearBias and macroBearOk ? -1 : 0
dirFlip = trendDir != nz(trendDir[1])
pbEma = ts_pbSrc == "1m EMA 20" ? pullbackEma_1m : ema21_5m
pbTol = ts_tolTicks * syminfo.mintick
var int ts_pbCount = 0 // confirmed pullbacks in the current trend
var bool ts_armed = false // price has traded fully clear of the EMA since the last pullback
var bool ts_inPb = false // EMA tagged, waiting for a new trend extreme
var bool ts_deep = false // the current pullback closed through the 5m EMA 55
var float ts_extreme = na // trend high (long) / low (short) before the current pullback
bool ts_pbConfirmed = false // true on the bar a pullback is confirmed (for markers)
if dirFlip
ts_pbCount := 0
ts_armed := false
ts_inPb := false
ts_deep := false
ts_extreme := trendDir == 1 ? high : trendDir == -1 ? low : na
if trendDir == 1
// resumption: new high beyond the pre-pullback high
if ts_inPb and high > ts_extreme
ts_pbConfirmed := not ts_deep
ts_pbCount := ts_deep ? 0 : ts_pbCount + 1
ts_inPb := false
ts_deep := false
ts_armed := false
if not ts_inPb
ts_extreme := math.max(nz(ts_extreme, high), high)
if not ts_armed and not ts_inPb and low > pbEma + pbTol
ts_armed := true
if ts_armed and not ts_inPb and low <= pbEma + pbTol
ts_inPb := true
ts_armed := false
if ts_inPb and ts_resetDeep and close < ema55_5m
ts_deep := true
else if trendDir == -1
// resumption: new low beyond the pre-pullback low
if ts_inPb and low < ts_extreme
ts_pbConfirmed := not ts_deep
ts_pbCount := ts_deep ? 0 : ts_pbCount + 1
ts_inPb := false
ts_deep := false
ts_armed := false
if not ts_inPb
ts_extreme := math.min(nz(ts_extreme, low), low)
if not ts_armed and not ts_inPb and high < pbEma - pbTol
ts_armed := true
if ts_armed and not ts_inPb and high >= pbEma - pbTol
ts_inPb := true
ts_armed := false
if ts_inPb and ts_resetDeep and close > ema55_5m
ts_deep := true
ts_sep = atr5m > 0 ? math.abs(ema21_5m - ema55_5m) / atr5m : 0.0
ts_structOk = ts_pbCount >= ts_pbNeeded
ts_sepOk = not ts_useSep or ts_sep >= ts_sepMin
ts_strong = ts_enable and trendDir != 0 and ts_structOk and ts_sepOk
strongLong = ts_strong and trendDir == 1
strongShort = ts_strong and trendDir == -1
string strengthTxt = not ts_enable or trendDir == 0 ? "" : ts_strong ? "STRONG" : "TENTATIVE"
string side = trendUp ? "LONG" : trendDown ? "SHORT" : "—"
string sideTxt = side + (side != "—" and strengthTxt != "" ? " · " + strengthTxt : "")
mnq_plotEmas = mnq_enable and mnq_showEmas
plot(mnq_plotEmas ? ema21_5m : na, color = color.orange, linewidth = 2, title = "5m EMA 21")
plot(mnq_plotEmas ? ema55_5m : na, color = color.blue, linewidth = 2, title = "5m EMA 55")
plot(mnq_plotEmas and useMacro200 ? ema200_5m : na, color = color.gray, linewidth = 2, title = "5m EMA 200")
plot(mnq_plotEmas ? pullbackEma_1m : na, color = color.white, linewidth = 1, title = "1m EMA 20 (pullback guide)")
// Strong = deeper shade, tentative = faint shade
bgTransp = not ts_enable ? 92 : ts_strong ? 86 : 96
bgcolor(mnq_showBg and trendUp ? color.new(color.green, bgTransp) : na, title = "Bull bias")
bgcolor(mnq_showBg and trendDown ? color.new(color.red, bgTransp) : na, title = "Bear bias")
tsMarks = mnq_enable and ts_enable and ts_showMarks
plotshape(tsMarks and ts_pbConfirmed and trendDir == 1, "Pullback confirmed (long)", shape.triangleup, location.belowbar, color.lime, size = size.tiny, text = "PB", textcolor = color.lime)
plotshape(tsMarks and ts_pbConfirmed and trendDir == -1, "Pullback confirmed (short)", shape.triangledown, location.abovebar, color.red, size = size.tiny, text = "PB", textcolor = color.red)
tsA = mnq_enable and ts_enable
alertcondition(tsA and strongLong and not strongLong[1], "Trend: LONG now STRONG", "5m long trend upgraded to STRONG")
alertcondition(tsA and strongShort and not strongShort[1], "Trend: SHORT now STRONG", "5m short trend upgraded to STRONG")
alertcondition(tsA and trendDir != 0 and trendDir == trendDir[1] and ts_strong[1] and not ts_strong, "Trend: downgraded to TENTATIVE", "5m trend downgraded from STRONG to TENTATIVE")
// Anchor
useManual = anchorMode == "Manual price" and manualAnchor != 0.0
anchorRaw = useManual ? manualAnchor : anchorMode == "Previous bar close" ? close[1] : close
anchor = roundToTick(anchorRaw)
string anchorLabel = useManual ? "Manual " : anchorMode == "Previous bar close" ? "Prev close " : "Live "
// Stop distance -> points and ticks
tickSize = syminfo.mintick
distPts = distUnit == "Ticks" ? roundToTick(distIn * tickSize) : roundToTick(distIn)
distTicks = math.round(distPts / tickSize)
upperLevel = anchor + distPts
lowerLevel = anchor - distPts
// Contract value & sizing
pointValue = pointValueOvr > 0 ? pointValueOvr : syminfo.pointvalue
tickValue = pointValue * tickSize
riskPerContract = distPts * pointValue
qty = riskPerContract > 0 ? math.floor(riskUsd / riskPerContract) : 0
actualRisk = qty * riskPerContract
// Bands
var line lUpper = na
var line lLower = na
if mnq_enable and mnq_showBands and barstate.islast
ext = extendRight ? extend.right : extend.none
if na(lUpper)
lUpper := line.new(bar_index, upperLevel, bar_index + 1, upperLevel, extend = ext, width = 2, color = color.lime)
line.set_xy1(lUpper, bar_index, upperLevel)
line.set_xy2(lUpper, bar_index + 1, upperLevel)
if na(lLower)
lLower := line.new(bar_index, lowerLevel, bar_index + 1, lowerLevel, extend = ext, width = 2, color = color.red)
line.set_xy1(lLower, bar_index, lowerLevel)
line.set_xy2(lLower, bar_index + 1, lowerLevel)
// Table
tblPos = tablePos == "Top left" ? position.top_left : tablePos == "Bottom right" ? position.bottom_right : tablePos == "Bottom left" ? position.bottom_left : tablePos == "Middle right" ? position.middle_right : position.top_right
var table t = table.new(tblPos, 2, 7)
if mnq_enable and showTable and barstate.islast
valueBg = color.rgb(20, 20, 20)
warnBg = color.rgb(90, 30, 30)
textCol = color.white
pvLooksWrong = pointValueOvr == 0 and syminfo.pointvalue != 2 and str.contains(syminfo.ticker, "MNQ")
color sideCol = trendUp ? (ts_enable and not ts_strong ? color.new(color.lime, 45) : color.lime) : trendDown ? (ts_enable and not ts_strong ? color.new(color.red, 45) : color.red) : textCol
table.cell(t, 0, 0, "Bias (5m 21/55)", bgcolor = valueBg, text_color = textCol)
table.cell(t, 1, 0, sideTxt, bgcolor = valueBg, text_color = sideCol)
string tsDetail = not ts_enable ? "off" :
"PB " + str.tostring(ts_pbCount) + "/" + str.tostring(ts_pbNeeded) + (ts_structOk ? " ✓" : " ✗") +
(ts_inPb ? (ts_deep ? " (deep pullback)" : " (in pullback)") : "") +
(ts_useSep ? " · Sep " + str.tostring(ts_sep, "#.##") + "×ATR" + (ts_sepOk ? " ✓" : " ✗") : "")
table.cell(t, 0, 1, "Strength", bgcolor = valueBg, text_color = textCol)
table.cell(t, 1, 1, tsDetail, bgcolor = valueBg, text_color = ts_strong ? color.lime : textCol)
table.cell(t, 0, 2, "Stop distance", bgcolor = valueBg, text_color = textCol)
table.cell(t, 1, 2, str.tostring(distPts, format.mintick) + " pts = " + str.tostring(distTicks) + " ticks", bgcolor = valueBg, text_color = textCol)
table.cell(t, 0, 3, "Tick / point value", bgcolor = pvLooksWrong ? warnBg : valueBg, text_color = textCol)
table.cell(t, 1, 3, "$" + str.tostring(tickValue, "#.##") + " / $" + str.tostring(pointValue, "#.##") + (pointValueOvr > 0 ? " (manual)" : " (auto)"), bgcolor = pvLooksWrong ? warnBg : valueBg, text_color = textCol)
table.cell(t, 0, 4, "Risk/Contract", bgcolor = valueBg, text_color = textCol)
table.cell(t, 1, 4, "$" + str.tostring(riskPerContract, "#.##"), bgcolor = valueBg, text_color = textCol)
table.cell(t, 0, 5, "Recommended Qty", bgcolor = valueBg, text_color = textCol)
table.cell(t, 1, 5, qty >= 1 ? str.tostring(qty) : "Too small (raise risk / tighter distance)", bgcolor = valueBg, text_color = textCol)
table.cell(t, 0, 6, "Actual risk at Qty", bgcolor = valueBg, text_color = textCol)
table.cell(t, 1, 6, "$" + str.tostring(actualRisk, "#.##") + " of $" + str.tostring(riskUsd, "#.##"), bgcolor = valueBg, text_color = textCol)
// ═══════════════════════════════════════════════════════════════════════════════════════════════
// 2 · S&R POWER CHANNEL — logic (© ChartPrime, MPL-2.0; adapted to v6, renamed identifiers)
// ═══════════════════════════════════════════════════════════════════════════════════════════════
type srData
line sup = na
line res = na
box sup_area = na
box res_area = na
sr_max_min(int length) =>
var max = array.new<float>(length)
var min = array.new<float>(length)
if barstate.islast
for i = 0 to length - 1
max.set(i, high[i])
min.set(i, low[i])
float max_ = max.max()
float min_ = min.min()
float mid_ = math.avg(max_, min_)
label.delete(label.new(bar_index + sr_extend + 15, max_, str.tostring(max_, "🡅 #.##"), color = color(na), style = label.style_label_center, textcolor = chart.fg_color)[1])
label.delete(label.new(bar_index + sr_extend + 15, min_, str.tostring(min_, "🡇 #.##"), color = color(na), style = label.style_label_center, textcolor = chart.fg_color)[1])
label.delete(label.new(bar_index + sr_extend, mid_, str.tostring(mid_, "🡆 #.##"), color = color(na), style = label.style_label_left, textcolor = color.gray)[1])
line.delete(line.new(bar_index - length, mid_, bar_index + sr_extend, mid_, color = color.gray, style = line.style_dotted)[1])
index_of_max = max.indexof(max_)
index_of_min = min.indexof(min_)
label.delete(label.new(bar_index[index_of_max], max_, "✖", color = color(na), textcolor = sr_t_col, size = size.normal, style = label.style_label_center)[1])
label.delete(label.new(bar_index[index_of_min], min_, "✖", color = color(na), textcolor = sr_b_col, size = size.normal, style = label.style_label_center)[1])
[max.max(), min.min()]
// v6 forbids history on UDT fields (d.sup[1]); instead the previous drawings are deleted
// just before new ones are created on each tick of the last bar.
sr_delete(srData d) =>
line.delete(d.sup)
line.delete(d.res)
box.delete(d.sup_area)
box.delete(d.res_area)
d.sup := line(na)
d.res := line(na)
d.sup_area := box(na)
d.res_area := box(na)
var array<label> sr_sigLabels = array.new_label()
sr_power(srData d) =>
int buy = 0
int sell = 0
if barstate.islast and sr_showPower
for i = 0 to sr_length - 1
buy += (close[i] > open[i] ? 1 : 0)
sell += (close[i] < open[i] ? 1 : 0)
if not na(d.sup_area) and not na(d.res_area)
d.sup_area.set_text(str.tostring(buy, " Buy Power: #"))
d.res_area.set_text(str.tostring(sell, " Sell Power: #"))
d.res_area.set_text_color(chart.fg_color)
d.sup_area.set_text_color(chart.fg_color)
d.res_area.set_text_halign(text.align_left)
d.sup_area.set_text_halign(text.align_left)
d.res_area.set_text_size(size.normal)
d.sup_area.set_text_size(size.normal)
sr_signals(srData d) =>
if barstate.islast and sr_showSignals and not na(d.sup_area) and not na(d.res_area)
// clear last tick's signal labels so they don't pile up on the realtime bar
while sr_sigLabels.size() > 0
label.delete(sr_sigLabels.pop())
top = d.sup_area.get_top()
bot = d.res_area.get_bottom()
for i = 0 to sr_length - 1
low_1 = low[i]
low_2 = low[i > 0 ? i + 1 : i]
high_1 = high[i]
high_2 = high[i > 0 ? i + 1 : i]
index = bar_index - i
if low_1 > top and low_2 <= top
sr_sigLabels.push(label.new(index, low_2, "◈", textcolor = sr_b_col, color = color(na), style = label.style_label_up, size = size.large))
if high_1 < bot and high_2 >= bot
sr_sigLabels.push(label.new(index, high_2, "◈", textcolor = sr_t_col, color = color(na), style = label.style_label_down, size = size.large))
sr_run() =>
float atr = srAtrHalf
var srData d = srData.new(line(na), line(na), box(na), box(na))
[mx, mn] = sr_max_min(sr_length)
if barstate.islast
sr_delete(d)
d.sup := line.new(bar_index - sr_length, mx + atr, bar_index + sr_extend + 30, mx + atr, color = sr_t_col, style = line.style_solid)
d.res := line.new(bar_index - sr_length, mn - atr, bar_index + sr_extend + 30, mn - atr, color = sr_b_col, style = line.style_solid)
d.res_area := box.new(bar_index - sr_length, mx + atr, bar_index + sr_extend, mx - atr, na, bgcolor = color.new(sr_t_col, 80))
d.sup_area := box.new(bar_index - sr_length, mn + atr, bar_index + sr_extend, mn - atr, na, bgcolor = color.new(sr_b_col, 80))
sr_signals(d)
sr_power(d)
if sr_enable
sr_run()
// ═══════════════════════════════════════════════════════════════════════════════════════════════
// 3 · VOLUME PROFILE — logic (© kv4coins, MPL-2.0)
// ═══════════════════════════════════════════════════════════════════════════════════════════════
// Splits the lookback's price range into equal bins and adds each bar's volume to every bin it
// traded through. PoC = the bin with most volume. Value Area = bins added outward from the PoC
// (larger neighbour first) until they hold the chosen share of total volume.
var int vp_tf_ms = 1000 * timeframe.in_seconds()
var int vp_lookback = vp_use_visible_range ? math.max(10, math.round((last_bar_time - chart.left_visible_bar_time) / vp_tf_ms)) : vp_lookback_depth
var line vp_poc = na
var line vp_vah = na
var line vp_val = na
var array<line> vp_bars = array.new_line()
var array<float> vp_volumes = array.new_float(vp_num_bars, 0)
float vp_highest = ta.highest(vp_lookback)
float vp_lowest = ta.lowest(vp_lookback)
float vp_interval = (vp_highest - vp_lowest) / (vp_num_bars - 1)
vp_scale(float vol, float mx) =>
float d = mx / vp_lookback / (vp_bar_len_mult / 100.0)
d > 0 ? math.round(vol / d) : 0
vp_calculate() =>
array.fill(vp_volumes, 0)
for i = 0 to (vp_lookback - 1)
bool is_bullish = close[i] >= open[i]
bool include_vol = vp_volume_type == 'Both' ? true : (vp_volume_type == 'Bullish' ? is_bullish : not is_bullish)
if include_vol
for j = 0 to (vp_num_bars - 1)
float price_level = vp_lowest + vp_interval * j
if price_level >= low[i] and price_level < high[i]
array.set(vp_volumes, j, vp_volumes.get(j) + volume[i])
vp_calculate_va(int max_idx, float max_vol) =>
float sum_vol = vp_volumes.sum()
float va_vol = sum_vol * vp_va_percent / 100.0
int va_up = max_idx
int va_dn = max_idx
float va_sum = max_vol
while va_sum < va_vol
float v_up = (va_up < vp_num_bars - 1) ? vp_volumes.get(va_up + 1) : 0.0
float v_dn = (va_dn > 0) ? vp_volumes.get(va_dn - 1) : 0.0
if v_up == 0 and v_dn == 0
break
if v_up >= v_dn
va_sum += v_up
va_up += 1
else
va_sum += v_dn
va_dn -= 1
[va_dn, va_up]
vp_draw() =>
float max_vol = vp_volumes.max()
int max_idx = math.max(0, vp_volumes.indexof(max_vol))
int x2 = bar_index + vp_right_offset
for i = 0 to (vp_num_bars - 1)
int vol = vp_scale(vp_volumes.get(i), max_vol)
int x1 = x2 - vol
float y = vp_lowest + vp_interval * i
line.set_xy1(vp_bars.get(i), x1, y)
line.set_xy2(vp_bars.get(i), x2, y)
line.set_color(vp_bars.get(i), max_idx == i ? vp_poc_line_color : vp_bar_color)
if vp_display_poc
int vol = vp_scale(max_vol, max_vol)
float y = vp_lowest + vp_interval * max_idx
line.set_xy1(vp_poc, bar_index - vp_lookback, y)
line.set_xy2(vp_poc, x2 - vol - 10, y)
if vp_display_va
[va_dn, va_up] = vp_calculate_va(max_idx, max_vol)
for i = va_dn to va_up
if i != max_idx
line.set_color(vp_bars.get(i), vp_va_bar_color)
if vp_display_va_lines
int vah_vol = vp_scale(vp_volumes.get(va_up), max_vol)
int val_vol = vp_scale(vp_volumes.get(va_dn), max_vol)
int va_x1 = bar_index - vp_lookback
float vah_y = vp_lowest + vp_interval * va_up
float val_y = vp_lowest + vp_interval * va_dn
line.set_xy1(vp_vah, va_x1, vah_y)
line.set_xy2(vp_vah, x2 - vah_vol - 10, vah_y)
line.set_xy1(vp_val, va_x1, val_y)
line.set_xy2(vp_val, x2 - val_vol - 10, val_y)
if vp_enable and barstate.isfirst
for i = 0 to (vp_num_bars - 1)
array.push(vp_bars, line.new(x1 = bar_index, y1 = close, x2 = bar_index, y2 = close, width = vp_bar_thickness))
if vp_display_poc
vp_poc := line.new(x1 = bar_index, y1 = close, x2 = bar_index, y2 = close, color = vp_poc_line_color, width = vp_poc_line_thickness)
if vp_display_va and vp_display_va_lines
vp_vah := line.new(x1 = bar_index, y1 = close, x2 = bar_index, y2 = close, color = vp_va_bar_color, width = vp_va_lines_thickness)
vp_val := line.new(x1 = bar_index, y1 = close, x2 = bar_index, y2 = close, color = vp_va_bar_color, width = vp_va_lines_thickness)
if vp_enable and barstate.islast
vp_calculate()
vp_draw()
// ═══════════════════════════════════════════════════════════════════════════════════════════════
// 4 · KEY LEVELS — logic
// ═══════════════════════════════════════════════════════════════════════════════════════════════
// Levels are drawn on the last bar only, so they cost nothing on history. Session highs/lows
// (overnight, opening range) keep their value after the session ends until the next one starts.
// Higher-timeframe values (lookahead_on + [1] = confirmed previous-period values, standard pattern)
[pdh, pdl, pdc, cdo] = request.security(syminfo.tickerid, "D", [high[1], low[1], close[1], open], lookahead = barmerge.lookahead_on)
[pwh, pwl, pwc, cwo] = request.security(syminfo.tickerid, "W", [high[1], low[1], close[1], open], lookahead = barmerge.lookahead_on)
[pmh, pml, cmo] = request.security(syminfo.tickerid, "M", [high[1], low[1], open], lookahead = barmerge.lookahead_on)
pdm = math.avg(pdh, pdl)
// Period start bars
var int dayStartBar = 0
var int weekStartBar = 0
var int monthStartBar = 0
if timeframe.change("1D")
dayStartBar := bar_index
if timeframe.change("1W")
weekStartBar := bar_index
if timeframe.change("1M")
monthStartBar := bar_index
// Today's running high / low
var float cdh = na
var float cdl = na
if timeframe.change("1D")
cdh := high
cdl := low
else
cdh := math.max(nz(cdh, high), high)
cdl := math.min(nz(cdl, low), low)
// Session ranges (overnight + opening range) — value persists after the session ends until the next one starts
inOn = not na(time(timeframe.period, kl_onSess, kl_tz))
inOr = not na(time(timeframe.period, kl_orSess, kl_tz))
var float onH = na
var float onL = na
var int onStartBar = 0
var float orH = na
var float orL = na
var int orStartBar = 0
if inOn and not inOn[1]
onH := high
onL := low
onStartBar := bar_index
else if inOn
onH := math.max(onH, high)
onL := math.min(onL, low)
if inOr and not inOr[1]
orH := high
orL := low
orStartBar := bar_index
else if inOr
orH := math.max(orH, high)
orL := math.min(orL, low)
orM = math.avg(orH, orL)
klStyle = kl_style == "Dashed" ? line.style_dashed : kl_style == "Dotted" ? line.style_dotted : line.style_solid
klExt = kl_extend ? extend.right : extend.none
// Draws / updates one level. Each call site gets its own `var` line + label.
kl_level(bool show, float price, int startBar, color col, string name) =>
var line ln = na
var label lb = na
bool draw = barstate.islast and show and not na(price)
if draw
int x1 = kl_fromStart ? math.max(startBar, bar_index - kl_maxBars) : bar_index - kl_maxBars
x1 := math.max(x1, 0)
int x2 = bar_index + kl_labelOff
string txt = name + (kl_showPrice ? " " + str.tostring(price, format.mintick) : "")
if na(ln)
ln := line.new(x1, price, x2, price, xloc.bar_index, klExt, col, klStyle, kl_width)
lb := label.new(x2, price, txt, xloc.bar_index, yloc.price, color(na), label.style_label_left, col, kl_labelSize)
line.set_xy1(ln, x1, price)
line.set_xy2(ln, x2, price)
line.set_color(ln, col)
line.set_style(ln, klStyle)
line.set_width(ln, kl_width)
line.set_extend(ln, klExt)
label.set_xy(lb, x2, price)
label.set_text(lb, txt)
label.set_textcolor(lb, col)
label.set_size(lb, kl_labelSize)
// separate `if` (no else) so both code paths have the same (void) type
if barstate.islast and not draw and not na(ln)
line.delete(ln)
label.delete(lb)
ln := line(na)
lb := label(na)
// Daily
kl_level(kl_enable and kl_pdh, pdh, dayStartBar, kl_pdCol, "PDH")
kl_level(kl_enable and kl_pdl, pdl, dayStartBar, kl_pdCol, "PDL")
kl_level(kl_enable and kl_pdc, pdc, dayStartBar, kl_pdCol, "PDC")
kl_level(kl_enable and kl_pdm, pdm, dayStartBar, color.new(kl_pdCol, 40), "PDM")
kl_level(kl_enable and kl_cdo, cdo, dayStartBar, kl_pdCol, "DO")
kl_level(kl_enable and kl_cdh, cdh, dayStartBar, color.new(kl_pdCol, 40), "HOD")
kl_level(kl_enable and kl_cdh, cdl, dayStartBar, color.new(kl_pdCol, 40), "LOD")
// Weekly
kl_level(kl_enable and kl_pwh, pwh, weekStartBar, kl_pwCol, "PWH")
kl_level(kl_enable and kl_pwl, pwl, weekStartBar, kl_pwCol, "PWL")
kl_level(kl_enable and kl_pwc, pwc, weekStartBar, kl_pwCol, "PWC")
kl_level(kl_enable and kl_cwo, cwo, weekStartBar, kl_pwCol, "WO")
// Monthly
kl_level(kl_enable and kl_pmh, pmh, monthStartBar, kl_pmCol, "PMH")
kl_level(kl_enable and kl_pml, pml, monthStartBar, kl_pmCol, "PML")
kl_level(kl_enable and kl_cmo, cmo, monthStartBar, kl_pmCol, "MO")
// Sessions
kl_level(kl_enable and kl_on, onH, onStartBar, kl_onCol, "ONH")
kl_level(kl_enable and kl_on, onL, onStartBar, kl_onCol, "ONL")
kl_level(kl_enable and kl_or, orH, orStartBar, kl_orCol, "ORH")
kl_level(kl_enable and kl_or, orL, orStartBar, kl_orCol, "ORL")
kl_level(kl_enable and kl_or and kl_orMid, orM, orStartBar, color.new(kl_orCol, 40), "ORM")
// Alerts (global scope). Only fire when the module + alerts are enabled.
klA = kl_enable and kl_alerts
xPdhUp = klA and ta.crossover(close, pdh)
xPdlDn = klA and ta.crossunder(close, pdl)
xPdc = klA and ta.cross(close, pdc)
xOnhUp = klA and ta.crossover(close, onH)
xOnlDn = klA and ta.crossunder(close, onL)
xOrhUp = klA and ta.crossover(close, orH)
xOrlDn = klA and ta.crossunder(close, orL)
alertcondition(xPdhUp, "KL: Close above PDH", "Close crossed above previous day high")
alertcondition(xPdlDn, "KL: Close below PDL", "Close crossed below previous day low")
alertcondition(xPdc, "KL: Close crossed PDC","Close crossed previous day close")
alertcondition(xOnhUp, "KL: Close above ONH", "Close crossed above overnight high")
alertcondition(xOnlDn, "KL: Close below ONL", "Close crossed below overnight low")
alertcondition(xOrhUp, "KL: Close above ORH", "Close crossed above opening-range high")
alertcondition(xOrlDn, "KL: Close below ORL", "Close crossed below opening-range low")
// ═══════════════════════════════════════════════════════════════════════════════════════════════
// 5 · VWAP — logic
// ═══════════════════════════════════════════════════════════════════════════════════════════════
// Volume-weighted average price since the chosen anchor, with bands at multiples of the
// volume-weighted standard deviation. The default anchor (18:00 New York) matches the CME Globex
// open, so the VWAP covers the full futures trading day.
// Anchor (true on the bar where VWAP resets). All ta.* calls at global scope.
inRth = not na(time(timeframe.period, vw_rthSess, kl_tz))
rthStart = inRth and not inRth[1]
// Custom time: shift time so the anchor clock time falls on midnight, then reset when the shifted date changes.
// Uses kl_tz, so America/New_York tracks the EST/EDT switch the same way CME does.
vwShiftMs = ((1440 - (vw_anchorH * 60 + vw_anchorM)) % 1440) * 60 * 1000
vwCustomDay = dayofmonth(time + vwShiftMs, kl_tz)
customStart = vwCustomDay != vwCustomDay[1]
vwAnchor = vw_anchor == "Custom time" ? customStart :
vw_anchor == "RTH session" ? rthStart :
vw_anchor == "Week" ? timeframe.change("1W") :
vw_anchor == "Month" ? timeframe.change("1M") :
timeframe.change("1D")
vwAnchor := vwAnchor or barstate.isfirst
// ta.vwap returns [vwap, upper, lower] for one multiplier; derive the other bands from the same σ
[vwV, vwU1, vwL1] = ta.vwap(vw_src, vwAnchor, vw_m1)
vwSd = (vwU1 - vwV) / vw_m1
vwU2 = vwV + vwSd * vw_m2
vwL2 = vwV - vwSd * vw_m2
vwU3 = vwV + vwSd * vw_m3
vwL3 = vwV - vwSd * vw_m3
[vwW, vwWU, vwWL] = ta.vwap(vw_src, timeframe.change("1W") or barstate.isfirst, 1.0)
// For the RTH anchor, hide the line outside the session so it doesn't drag across the overnight
vwVisible = vw_enable and (vw_anchor != "RTH session" or inRth)
plot(vwVisible ? vwV : na, "VWAP", color = vw_col, linewidth = vw_width)
pU1 = plot(vwVisible and vw_b1 ? vwU1 : na, "VWAP +1σ", color = color.new(vw_bandCol, 30), linewidth = 1)
pL1 = plot(vwVisible and vw_b1 ? vwL1 : na, "VWAP -1σ", color = color.new(vw_bandCol, 30), linewidth = 1)
pU2 = plot(vwVisible and vw_b2 ? vwU2 : na, "VWAP +2σ", color = color.new(vw_bandCol, 50), linewidth = 1)
pL2 = plot(vwVisible and vw_b2 ? vwL2 : na, "VWAP -2σ", color = color.new(vw_bandCol, 50), linewidth = 1)
pU3 = plot(vwVisible and vw_b3 ? vwU3 : na, "VWAP +3σ", color = color.new(vw_bandCol, 65), linewidth = 1)
pL3 = plot(vwVisible and vw_b3 ? vwL3 : na, "VWAP -3σ", color = color.new(vw_bandCol, 65), linewidth = 1)
fill(pU1, pL1, color = vwVisible and vw_fill and vw_b1 ? color.new(vw_bandCol, 92) : na, title = "Band 1 fill")
fill(pU2, pL2, color = vwVisible and vw_fill and vw_b2 ? color.new(vw_bandCol, 95) : na, title = "Band 2 fill")
fill(pU3, pL3, color = vwVisible and vw_fill and vw_b3 ? color.new(vw_bandCol, 97) : na, title = "Band 3 fill")
plot(vw_enable and vw_showW ? vwW : na, "Weekly VWAP", color = vw_wCol, linewidth = 1, style = plot.style_line)
vwA = vw_enable and vw_alerts
xVwUp = vwA and ta.crossover(close, vwV)
xVwDn = vwA and ta.crossunder(close, vwV)
alertcondition(xVwUp, "VWAP: Close above VWAP", "Close crossed above VWAP")
alertcondition(xVwDn, "VWAP: Close below VWAP", "Close crossed below VWAP")
// ═══════════════════════════════════════════════════════════════════════════════════════════════
// 6 · FAIR VALUE GAPS — inputs
// ═══════════════════════════════════════════════════════════════════════════════════════════════
// A fair value gap (FVG) is a three-bar imbalance. Bullish: bar 3's low is above bar 1's high, so
// bar 2 travelled through a price range that no other bar traded. Bearish: the mirror image.
// Gaps are often revisited; this module draws them, filters them by the 5m bias from module 1,
// and outlines the most recent gap in the bias direction as the "active" one.
G_FVG1 = "6 · FVG · Detection"
G_FVG2 = "6 · FVG · Bias Filter"
G_FVG3 = "6 · FVG · Style"
G_FVG4 = "6 · FVG · Forming / Confirmation"
fvg_minAtr = input.float(0.0, "Minimum gap size (× ATR)", minval = 0, step = 0.05, group = G_FVG1,
tooltip = "Ignore gaps smaller than this many ATRs, measured on the FVG timeframe. 0 = keep every gap.")
fvg_atrLen = input.int(14, "ATR length", minval = 1, group = G_FVG1)
fvg_tf = input.timeframe("", "Timeframe", group = G_FVG1,
tooltip = "Blank = chart timeframe. A higher timeframe (e.g. 5 or 15) finds gaps on that timeframe and draws them on this chart.")
fvg_filterMode = input.string("At formation", "Bias filter", options = ["At formation", "Current bias", "Off"], group = G_FVG2,
tooltip = "At formation: an FVG is kept only if it matched the 5m bias on the bar it confirmed. Boxes stay once drawn.\nCurrent bias: every FVG is recorded, but only those matching the bias right now are shown. When the bias flips, the visible set flips with it.\nOff: show every FVG.")
fvg_biasSrc = input.string("Table bias (21/55 + EMA200)", "Bias source", options = ["Table bias (21/55 + EMA200)", "EMA 21/55 only"], group = G_FVG2,
tooltip = "Table bias = the LONG / SHORT shown in the sizing table (21/55 cross, plus the EMA200 macro filter if enabled in module 1). EMA 21/55 only ignores the EMA200.")
fvg_neutralShow = input.bool(false, "Show both directions when bias is neutral", group = G_FVG2,
tooltip = "Neutral = 21/55 and EMA200 disagree. Off = no FVGs while neutral.")
fvg_requireStrong = input.bool(false, "Only when trend is STRONG", group = G_FVG2,
tooltip = "Adds the module 1b strength check on top of the bias filter: an FVG passes only if the trend in its direction is STRONG. Ignored if Trend Strength is switched off.")
fvg_extend = input.int(20, "Extend (bars)", minval = 0, group = G_FVG3)
fvg_maxBoxes = input.int(100, "Max FVG boxes kept", minval = 1, maxval = 450, group = G_FVG3)
fvg_bullCss = input.color(color.new(#089981, 50), "Bullish FVG", inline = "fvgcol", group = G_FVG3)
fvg_bearCss = input.color(color.new(#f23645, 50), "Bearish FVG", inline = "fvgcol", group = G_FVG3)
fvg_outline = input.color(color.yellow, "Active FVG outline", inline = "fvgout", group = G_FVG3)
fvg_outWidth = input.int(2, "Width", minval = 1, maxval = 4, inline = "fvgout", group = G_FVG3)
fvg_showLive = input.bool(true, "Show forming FVGs", group = G_FVG4,
tooltip = "Realtime only: shades a gap while its third bar is still open. It is locked in or discarded when that bar closes.")
fvg_bullFormCss = input.color(color.new(#089981, 90), "Forming bullish", inline = "fvgform", group = G_FVG4)
fvg_bearFormCss = input.color(color.new(#f23645, 90), "Forming bearish", inline = "fvgform", group = G_FVG4)
fvg_formBorder = input.bool(false, "Dashed outline on forming", group = G_FVG4)
fvg_showConf = input.bool(true, "Show confirmation marker", group = G_FVG4)
fvg_confBullCss = input.color(#089981, "Bullish", inline = "fvgconf", group = G_FVG4)
fvg_confBearCss = input.color(#f23645, "Bearish", inline = "fvgconf", group = G_FVG4)
// ═══════════════════════════════════════════════════════════════════════════════════════════════
// 6 · FAIR VALUE GAPS — logic
// ═══════════════════════════════════════════════════════════════════════════════════════════════
// One recorded gap. Kept until price closes back through it twice in a row (mitigation).
type FairValueGap
float top
float bottom
bool isBull
int leftTime
// Looks at the last three bars of whatever series it runs on (chart or FVG timeframe).
// Returns [bullish gap?, bearish gap?, gap top, gap bottom, time of the first of the three bars].
fvg_scan() =>
float atrV = ta.atr(fvg_atrLen)
float minSize = fvg_minAtr * atrV
bool bullGap = low > high[2] and close[1] > high[2] and low - high[2] >= minSize
bool bearGap = high < low[2] and close[1] < low[2] and low[2] - high >= minSize
float gapTop = bullGap ? low : bearGap ? low[2] : na
float gapBot = bullGap ? high[2] : bearGap ? high : na
[bullGap, bearGap, gapTop, gapBot, time[2]]
// The same scan one bar back: only gaps whose third bar has closed. Used with lookahead_on,
// this is the standard non-repainting way to read a completed higher-timeframe bar.
fvg_scanClosed() =>
[b, s, tp, bt, lt] = fvg_scan()
[b[1], s[1], tp[1], bt[1], lt[1]]
// Developing (still-open) bar: realtime only, so no lookahead is needed.
[fvgLiveBull, fvgLiveBear, fvgLiveMax, fvgLiveMin, fvgLiveT] = request.security(syminfo.tickerid, fvg_tf, fvg_scan())
// Last completed bar: drives everything that is drawn permanently.
[fvgBullConf, fvgBearConf, fvgConfMax, fvgConfMin, fvgConfT] = request.security(syminfo.tickerid, fvg_tf, fvg_scanClosed(), lookahead = barmerge.lookahead_on)
fvgHtfChange = fvg_tf == "" ? true : timeframe.change(fvg_tf) // true on the first chart bar of each FVG-timeframe bar
fvgChartMs = timeframe.in_seconds() * 1000
// 5m bias used by the filter (independent of the module-1 on/off switch)
fvgUseTableBias = fvg_biasSrc == "Table bias (21/55 + EMA200)"
fvgBiasLong = bullBias and (not fvgUseTableBias or macroBullOk)
fvgBiasShort = bearBias and (not fvgUseTableBias or macroBearOk)
fvgNeutral = not fvgBiasLong and not fvgBiasShort
// Does a gap in this direction pass the bias (and optional strength) filter right now?
fvg_allowed(bool isBull) =>
bool biasOk = fvg_filterMode == "Off" or (isBull ? fvgBiasLong : fvgBiasShort) or (fvgNeutral and fvg_neutralShow)
bool strongOk = not fvg_requireStrong or not ts_enable or (isBull ? strongLong : strongShort)
biasOk and strongOk
var array<FairValueGap> fvg_records = array.new<FairValueGap>() // unmitigated gaps, newest first
var array<box> fvg_boxes = array.new<box>() // drawn boxes, newest first
var array<bool> fvg_boxBull = array.new<bool>() // direction of each drawn box
var box fvg_liveBox = na // the forming box on the realtime bar
var box fvg_hlBox = na // box currently carrying the "active" outline
var FairValueGap fvg_lastBull = na
var FairValueGap fvg_lastBear = na
var box fvg_lastBullBox = na
var box fvg_lastBearBox = na
var int fvg_bullMitCount = 0
var int fvg_bearMitCount = 0
// Bias check on the bar the FVG confirms (drives markers and alerts in every mode)
fvgNewBull = fvg_enable and fvgHtfChange and fvgBullConf and fvg_allowed(true)
fvgNewBear = fvg_enable and fvgHtfChange and fvgBearConf and fvg_allowed(false)
// ── Confirmation: when an FVG-timeframe bar closes, lock in the forming box or discard it
if fvg_enable and fvgHtfChange
if fvgBullConf or fvgBearConf
bool isBull = fvgBullConf
bool passes = fvg_allowed(isBull)
if passes or fvg_filterMode == "Current bias"
color col = isBull ? fvg_bullCss : fvg_bearCss
int fvgRight = time + fvg_extend * fvgChartMs
box b = na
if not na(fvg_liveBox)
// reuse the forming box so it doesn't flicker
b := fvg_liveBox
box.set_lefttop(b, fvgConfT, fvgConfMax)
box.set_rightbottom(b, fvgRight, fvgConfMin)
box.set_bgcolor(b, col)
box.set_border_color(b, color(na))
box.set_border_style(b, line.style_solid)
box.set_border_width(b, fvg_outWidth)
fvg_liveBox := na
else
b := box.new(fvgConfT, fvgConfMax, fvgRight, fvgConfMin, border_color = color(na), border_width = fvg_outWidth,
xloc = xloc.bar_time, bgcolor = col)
fvg_boxes.unshift(b)
fvg_boxBull.unshift(isBull)
if fvg_boxes.size() > fvg_maxBoxes
box.delete(fvg_boxes.pop())
fvg_boxBull.pop()
FairValueGap rec = FairValueGap.new(fvgConfMax, fvgConfMin, isBull, fvgConfT)
fvg_records.unshift(rec)
if fvg_records.size() > 500
fvg_records.pop()
if isBull
fvg_lastBull := rec
fvg_lastBullBox := b
else
fvg_lastBear := rec
fvg_lastBearBox := b
else if not na(fvg_liveBox)
box.delete(fvg_liveBox)
fvg_liveBox := na
if passes
alert((isBull ? "Bullish" : "Bearish") + " FVG confirmed (with bias). Low: " + str.tostring(fvgConfMin, format.mintick) + ", High: " + str.tostring(fvgConfMax, format.mintick), alert.freq_once_per_bar)
else if not na(fvg_liveBox)
// the bar closed without a valid gap: discard the forming box
box.delete(fvg_liveBox)
fvg_liveBox := na
// ── Forming FVG (realtime only, bias-filtered)
fvgLiveActive = fvg_enable and fvg_showLive and barstate.isrealtime and (fvgLiveBull or fvgLiveBear) and fvg_allowed(fvgLiveBull)
if fvgLiveActive
color fillCol = fvgLiveBull ? fvg_bullFormCss : fvg_bearFormCss
color border = fvg_formBorder ? color.new(fillCol, 0) : color(na)
int fvgRight = time + fvg_extend * fvgChartMs
if na(fvg_liveBox)
fvg_liveBox := box.new(fvgLiveT, fvgLiveMax, fvgRight, fvgLiveMin, border_color = border, border_width = 1,
border_style = line.style_dashed, xloc = xloc.bar_time, bgcolor = fillCol)
alert((fvgLiveBull ? "Bullish" : "Bearish") + " FVG forming (with bias)", alert.freq_once_per_bar)
else
box.set_lefttop(fvg_liveBox, fvgLiveT, fvgLiveMax)
box.set_rightbottom(fvg_liveBox, fvgRight, fvgLiveMin)
box.set_border_color(fvg_liveBox, border)
box.set_border_style(fvg_liveBox, line.style_dashed)
box.set_bgcolor(fvg_liveBox, fillCol)
else if not na(fvg_liveBox)
// gap closed mid-bar or the bias flipped: hide it; it reappears if conditions return before the bar closes
box.set_border_color(fvg_liveBox, color(na))
box.set_bgcolor(fvg_liveBox, color(na))
// ── Forming FVG alerts: once per FVG-timeframe bar per direction, the moment a gap starts forming.
// varip so the "already alerted" flag survives intrabar ticks instead of rolling back.
varip bool fvgFormBullDone = false
varip bool fvgFormBearDone = false
if barstate.isnew and fvgHtfChange
fvgFormBullDone := false
fvgFormBearDone := false
bool fvgFormingBull = fvgLiveActive and fvgLiveBull and not fvgFormBullDone
bool fvgFormingBear = fvgLiveActive and fvgLiveBear and not fvgFormBearDone
if fvgFormingBull
fvgFormBullDone := true
if fvgFormingBear
fvgFormBearDone := true
alertcondition(fvgFormingBull, "FVG: Bullish forming (with bias)", "Bullish FVG forming in line with 5m bias")
alertcondition(fvgFormingBear, "FVG: Bearish forming (with bias)", "Bearish FVG forming in line with 5m bias")
// ── Mitigation: a gap is done once two consecutive closes sit beyond its far edge
if fvg_enable and fvg_records.size() > 0
for i = fvg_records.size() - 1 to 0
FairValueGap g = fvg_records.get(i)
bool alertOk = fvg_filterMode != "Current bias" or fvg_allowed(g.isBull)
if g.isBull and close < g.bottom and close[1] < g.bottom
fvg_records.remove(i)
if alertOk
fvg_bullMitCount += 1
alert("Bullish FVG mitigated at " + str.tostring(g.bottom, format.mintick), alert.freq_once_per_bar_close)
else if not g.isBull and close > g.top and close[1] > g.top
fvg_records.remove(i)
if alertOk
fvg_bearMitCount += 1
alert("Bearish FVG mitigated at " + str.tostring(g.top, format.mintick), alert.freq_once_per_bar_close)
// ── Active FVG = the latest gap in the current bias direction (or the latest overall when unfiltered)
bool fvgLatestIsBull = not na(fvg_lastBull) and (na(fvg_lastBear) or fvg_lastBull.leftTime >= fvg_lastBear.leftTime)
bool fvgAnyFvg = not na(fvg_lastBull) or not na(fvg_lastBear)
int fvgActiveDir = fvg_filterMode == "Off" or (fvgNeutral and fvg_neutralShow) ? (not fvgAnyFvg ? 0 : fvgLatestIsBull ? 1 : -1) :
fvgBiasLong ? 1 : fvgBiasShort ? -1 : 0
if fvg_enable and barstate.islast
// Current-bias mode: show only boxes that match the bias right now
if fvg_filterMode == "Current bias" and fvg_boxes.size() > 0
for i = 0 to fvg_boxes.size() - 1
bool isB = fvg_boxBull.get(i)
box.set_bgcolor(fvg_boxes.get(i), fvg_allowed(isB) ? (isB ? fvg_bullCss : fvg_bearCss) : color(na))
// Move the outline to the active FVG
if not na(fvg_hlBox)
box.set_border_color(fvg_hlBox, color(na))
box activeBox = fvgActiveDir == 1 ? fvg_lastBullBox : fvgActiveDir == -1 ? fvg_lastBearBox : box(na)
if not na(activeBox)
box.set_border_color(activeBox, fvg_outline)
box.set_border_width(activeBox, fvg_outWidth)
fvg_hlBox := activeBox
// ── Confirmation markers + alert conditions
plotshape(fvg_showConf and fvgNewBull, "FVG bullish confirmed", shape.circle, location.abovebar, fvg_confBullCss, offset = -1, size = size.tiny)
plotshape(fvg_showConf and fvgNewBear, "FVG bearish confirmed", shape.circle, location.abovebar, fvg_confBearCss, offset = -1, size = size.tiny)
alertcondition(fvgNewBull, "FVG: Bullish confirmed (with bias)", "Bullish FVG confirmed in line with 5m bias")
alertcondition(fvgNewBear, "FVG: Bearish confirmed (with bias)", "Bearish FVG confirmed in line with 5m bias")
alertcondition(fvg_bullMitCount > fvg_bullMitCount[1], "FVG: Bullish mitigated", "Bullish FVG mitigated")
alertcondition(fvg_bearMitCount > fvg_bearMitCount[1], "FVG: Bearish mitigated", "Bearish FVG mitigated")